Formulation of AB testing metrics
As a part of the SQL course “Wrangling, Analysis and AB Testing with SQL” I was presented with an assignment to formulate AB testing metrics and analysing it a GitHub AB testing emulator.
Objective
The objective of this assignment is to assess how different layouts on item pages influence user engagement, conversion rates, and other relevant metrics. This task, referred to as "item_test_2," aims to analyze customer behavior by defining specific metrics.
The metrics to be examined include:
Binary metrics for order activity within a 30-day period following the test_start_date for "item_test_2"
Binary metrics for viewing activity within a 30-day period following the test_start_date for "item_test_2"
By conducting A/B testing on these metrics individually, we aim to determine the impact of the test on the company's performance and draw conclusions accordingly.
Note: 0: Before test; 1: After Test.
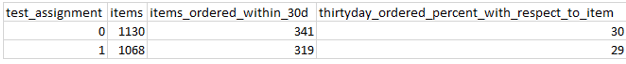
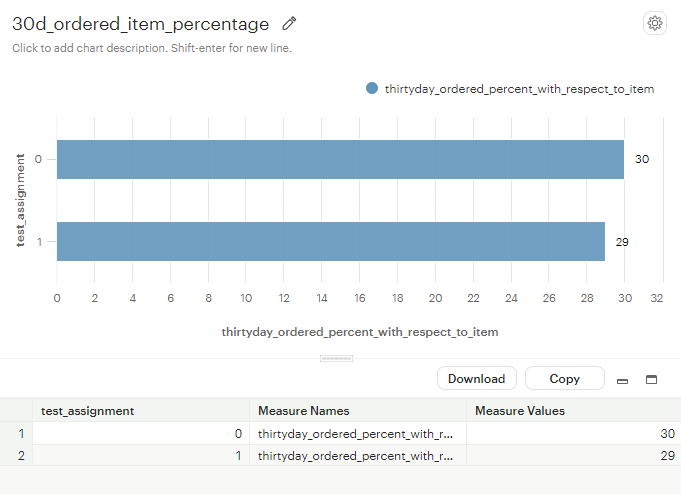
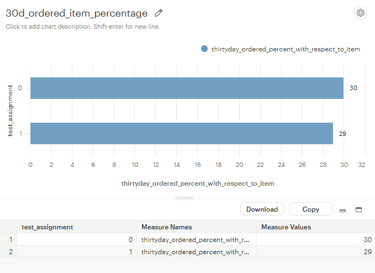
Calculating order binary for 'ITEM_TEST_2' 30 days after the test start date
Calculated binary results for orders both instantly and within a 30-day window, considering each item's order occurrence.
Focusing on items tested with "Item_test_2."
We've added a column displaying order percentages relative to the total items.
Results indicate a 1% decrease in orders post-assignment, as depicted in the graph below.
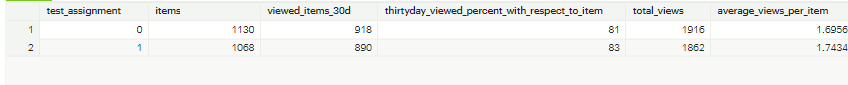
Calculating View binary for 'ITEM_TEST_2' 30 days after the test start date
Calculated binary views for items before and after the test, regardless of the view frequency. We're specifically interested in items tested with "Item_test_2."
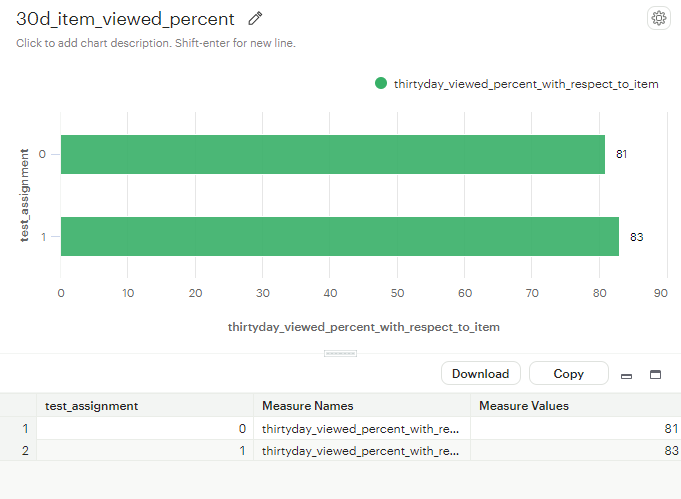
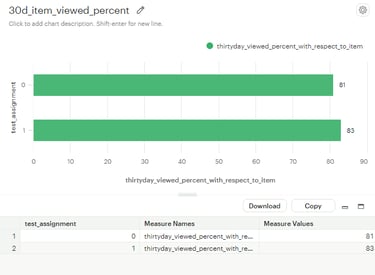
I've created a column to display the percentage of views relative to the total item count.
Results show a 2% increase in views post-test assignment, as illustrated in the graph below.
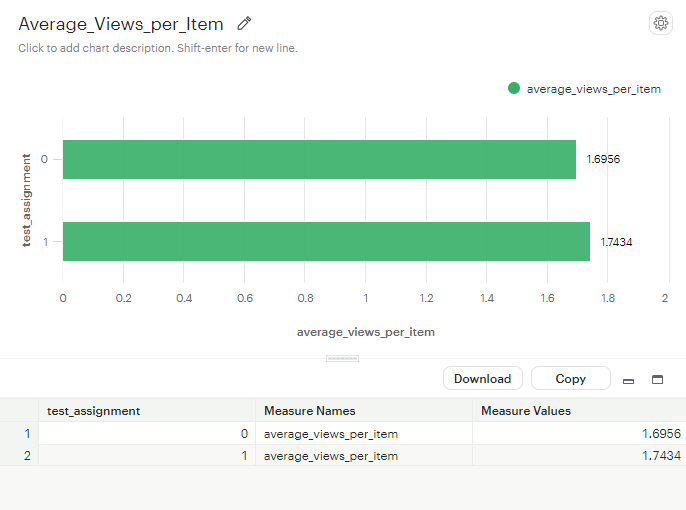
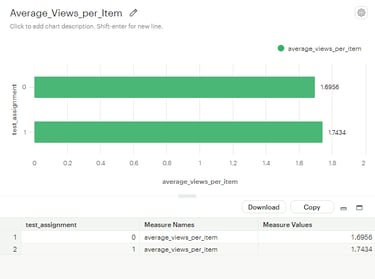
Calculating the average views per item, there's an increase, but its significance will be explored in upcoming questions.
COMPUTING LIFT AND P-VALUE
Using the https://thumbtack.github.io/abba/demo/abba.html to compute the lifts in metrics and the p-values for the binary metrics ( 30 day order binary and 30 day view binary) using a interval 95% confidence.
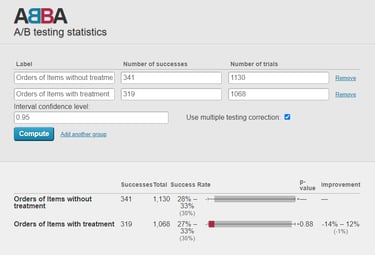
ORDERS
Here, after the treatment, the orders within 30 days have declined by 1 percent in accordance with the items.

VIEWS
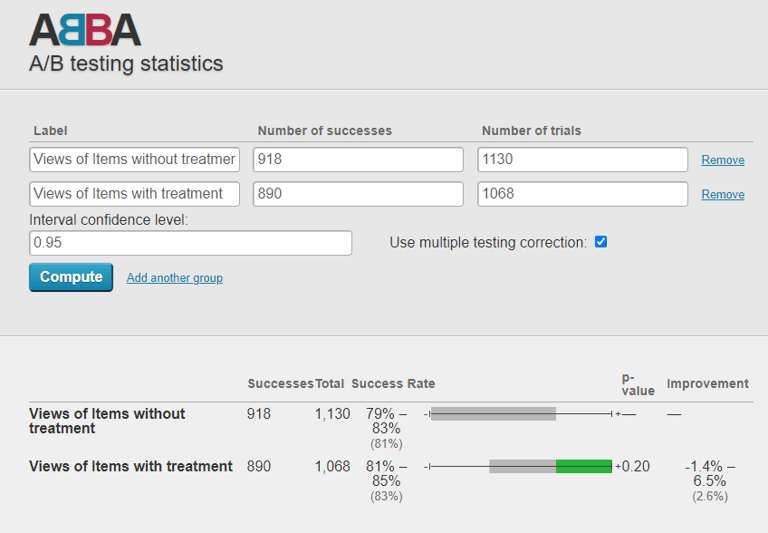

Here, there is an improvement in the number of views in 30 days with respect to items of 2.6 percent.
But while also looking at the P-value, it is just 0.2.
INSIGHTS AND RECOMMENDATION
Orders decreased by 1% post-assignment.
Views increased by 2.6%, but the P-value is only 0.2.
Significance typically requires a P-value of at least 0.5.
Reduced orders and a low P-value suggest Item_test_2 isn't enhancing item performance.
Therefore, I recommend not proceeding with the new page layout.
Navigate to view details to access code.