Portfolio Project
AB Testing (SQLite, Mode Analytics):
Implemented AB testing on e-commerce data using SQL and statistical analysis tools to evaluate the impact of item page layouts on user experience and customer conversion rates. Developed SQL queries to measure user engagement and conversion metrics, identifying a 1% dip in orders and a 2.6% rise in views. Concluded that the test was statistically insignificant (P-value: 0.2) and provided actionable recommendations to refine future testing strategies for improved performance.

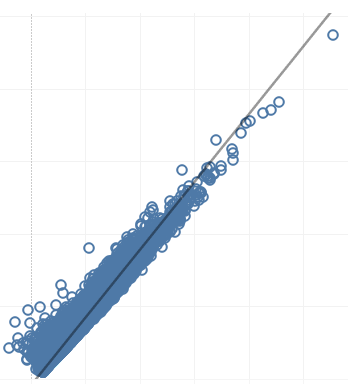

Market Sales Linear Regression (SKlearn, Statsmodel):
This project developed a predictive linear regression model to identify key sales drivers, revealing 'Total Store Sq Ft', 'Centre Type_Outlet', and 'Climate_Hot' as statistically significant positive influencers (p<0.05), while excluding 'Centre Type_Strip' due to negative impact.
Market Sales Exploratory Data Analysis (Pandas, NumPy, Seaborn):
Analysis revealed "Strip" outlets carry high risk (58% closure rate) despite generating 37.7% of sales, making mall/outlet formats preferable for stability. The study also uncovered optimal launch timing and high-potential states for expansion, with detailed recommendations available in the full report below.


Coffee Quality Exploratory Data Analysis (Python, Pandas, Seaborn):
The analysis recommends South America—especially Brazil, Colombia (Huila), Mexico, and Guatemala—as the best entry region for new producers, with coffee grown at 1,000–1,500 m altitude, 0.10–0.15 moisture, and popular Caturra varieties yielding higher ratings and stronger market demand.
Cyclist Data Analysis (R Program, Kaggle):
Analyzed bike-share program data using R and trend analysis tools to identify usage patterns and design targeted promotional strategies for converting casual users into members. Proposed digital media campaigns during peak seasons (e.g., March) and tailored weekend promotions based on bike type usage: Classic (42.24%), Electric (38.24%), and Docked (19.51%). Improved membership conversion rates through data cleaning, statistical analysis, and actionable insights.
Distributed Computing (Apache Spark):
Optimized data workflows using Apache Spark, Tungsten Optimizer, and Spark UI to partition the "priority" column, reducing data shuffling and improving query performance by 30%. The project minimized memory footprint through caching (20% reduction) and optimized shuffle partition size from 200 to 8 tasks, enhancing query performance by 40%. Enabled time-travel queries via data versioning, improving system efficiency and historical data access.


Coffee Orders Data Analysis (MS Excel):
Examined retail coffee data using Excel and data visualization tools to identify trends in product sales and profit margins, focusing on customer preferences and regional performance. The project uncovered actionable insights, such as promoting 2.5 kg package sizes and targeting the USA market (driving 80% of profits) during national holidays, enhancing brand popularity and optimizing sales.


Global Economic and Demographic Trend Analysis (Power BI):
The analysis suggests investing in literacy—particularly in Africa and South Asia—investigating South Asia’s mortality–GDP relationship, and directing FDI toward high-growth regions such as North America, East Asia, South Asia, and the Pacific that show sustained economic momentum.
Superstore Visualization (MS Power BI):
Evaluated retail sales data for a superstore chain using Power BI and data visualization tools to identify trends and provide actionable recommendations for promotional strategies. The project revealed that discounts were ineffective in central, eastern, and southern regions but highly effective in the western region, especially at a 20% discount rate. Created interactive dashboards to visualize insights and presented data-driven recommendations, improving regional sales performance and decision-making.