Superstore Data Visualization
Participating in the Growth School Power BI workshop, I engaged in the "Superstore" case study, a practical exercise that allowed me to uncover valuable insights from raw data.
Objective
The Superstore Giant is seeking guidance to determine the optimal approach amidst increasing market demands and intense competition. They would like to identify the products, regions, categories, and customer segments that would yield the best results for their business, as well as those they should steer clear of.
Regional Visualization
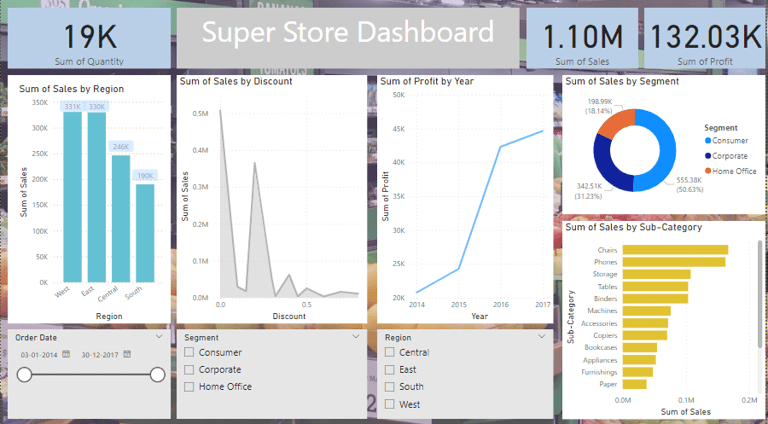

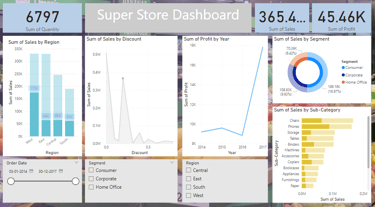
The charts, graphs, and slicers in this visualization help us explore the impact of discounts on sales and profit at both regional and subcategory levels - Let’s Explore Further.
Regional Visualization, Zero Discount
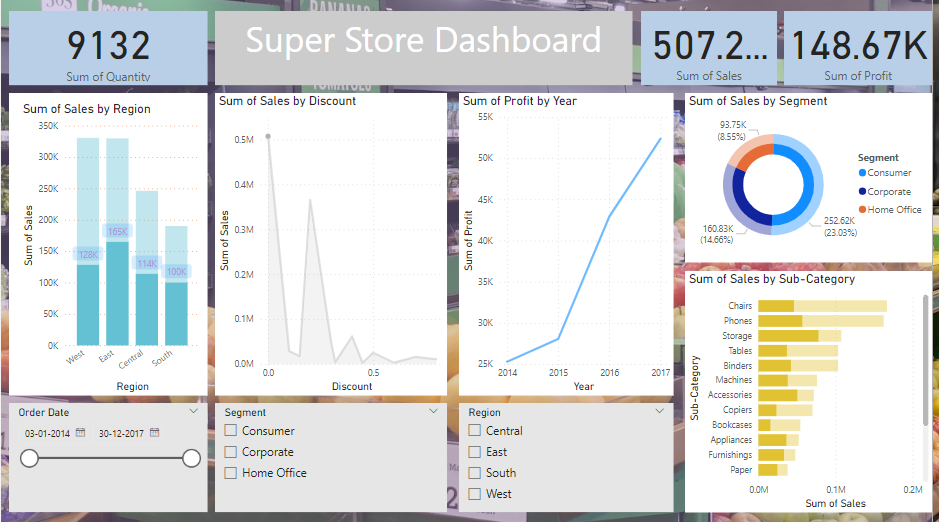
When interacting with the visual and filtering the data for zero percent discount rates in sales, it becomes evident that, except for the western region, all other regions had more than half of their sales at zero percent discount rates
Regional Visualization, Twenty Percent Discount
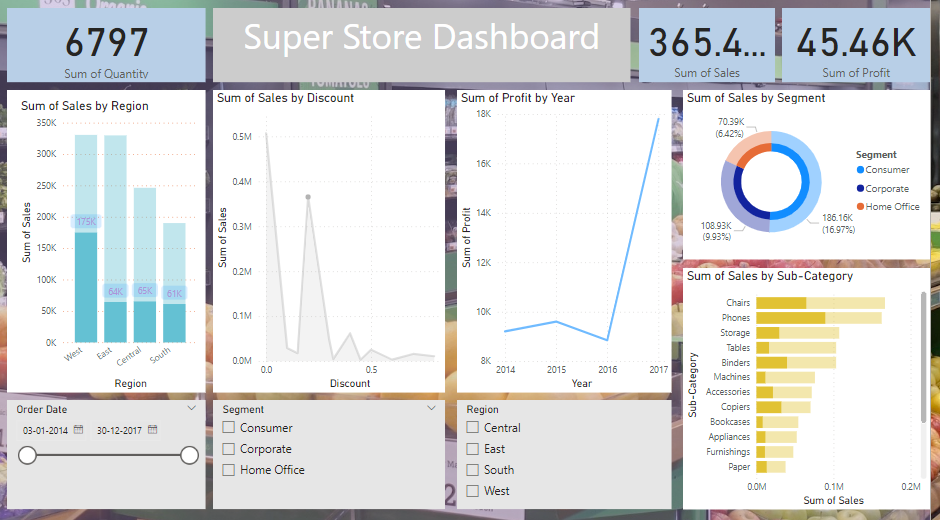
Interacting with the visual indicated that the West region of the United States had increased sales with the increase in discount to a particular extent. Especially when the discount rate was 20 percent, the region had more than half of its sales.
Categorial Visualization

The charts, graphs, and slicers in this visualization help us visualize the impact on sales and profit with respect to category as well as regionally - Let’s Explore Further.
Categorial Visualization, Slicing Central Region and Corporate Segment
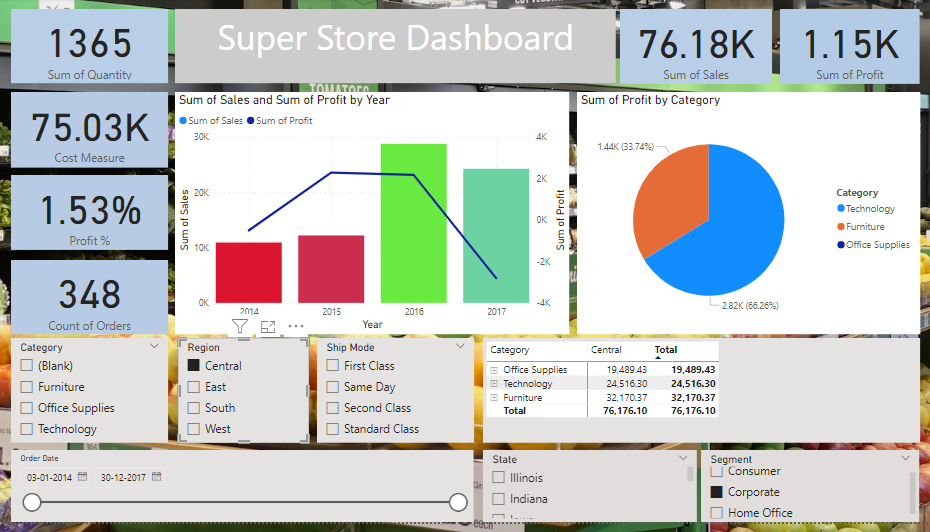

Interacting with the slicers and filtering the visuals for the central region and corporate segment reveals that the profit margin for the corporate segment in the central region is only 1.53%, with a total profit of just $1.15k. This performance raises questions about the viability of continuing the corporate segment in the central region.
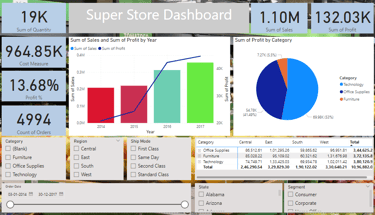
Categorial Visualization, Slicing Western Region and Corporate Segment

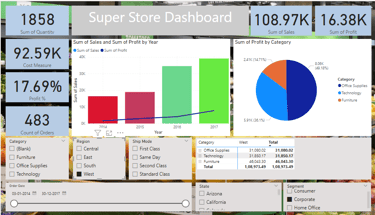
Slicing the data for the corporate segment and western region reveals impressive results. The profit margin is approximately 17.69%, totaling around $16.38k. This suggests that stakeholders may consider focusing more on the western region instead of the underperforming corporate segment in the central region.
Recommendation: On Discounts
Based on these insights, stakeholders can make informed decisions regarding discount strategies. They may consider discontinuing discounts in the central, east, and south regions and reevaluating their implementation across different areas. With more than 50% of sales occurring without any discounts in these regions, stakeholders might opt for alternative promotional strategies instead.
In the western region, stakeholders might contemplate promoting products with a discount range of approximately plus or minus 20 percent. This is due to the fact that over 50 percent of sales in the western region were made with a 20 percent discount.
By implementing such strategies, the company has the potential to improve its sales performance.
Recommendation: Corporate Segment
With a meager profit margin of only 1.53% and a total profit of a mere $1.15k, the corporate segment in the central region displays lackluster performance. These results prompt stakeholders to question the feasibility of maintaining the corporate segment in this region.
In contrast, the corporate segment in the western region boasts a noteworthy statistic: a profit percentage of approximately 17.69% and a total profit amounting to approximately $16.38k. This data offers stakeholders a compelling reason to prioritize the western region over the underperforming corporate segment in the central region.